High-dimensional and Multivariate stuff
Few years ago I started to read and listen that shape is a high-dimensional AND multivariate character (e. g. in Klingenberg & Gidazewski Sys Bio 2010 or in a talk by Dean Adams at the SMEF 16 in Paris). To my embarrassment it wasn’t until some time afterwards that I understood why these adjectives weren’t synonyms. Shape is usually described by a large set of variables or measurements, which makes it high-dimensional, but these variables need to be considered altogether when analyzed statistically, which makes shape multivariate. The alternative would be to assess variation on each variable independently, but that would be less efficient (you would lose track of covariation among variables, to visualize that I love the figure in Albretch Am Zool 1980). Also, the multiple univariate assessment of shape variables would be conceptually incorrect for geometric morphometrics (what’s the meaning of one or few landmarks when the superimposition was run for all of them?).
Curse of the dimensionality
So shape analyses consist on the variation of many variables on many individuals, all at the same time. Intuitively, we could think that the more variables the better: a more accurate description of the individual shape would maximize the differences among the individuals and therefore obtain the important features in the sample shape variability. Graphical representations would have more resolution too.
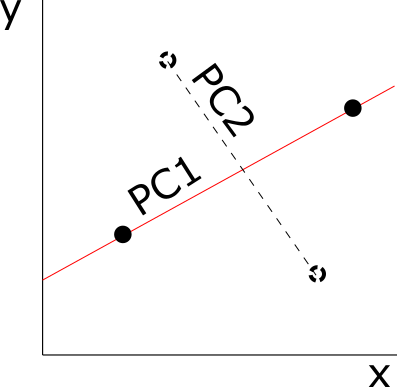
Now, the question is how many individuals per variable. Is that important? Let’s use a toy example with two individuals and two variables. Imagine we were interested in looking at the association between these two shape variables in our sample of 2 individuals:

There are two ways of thinking at this. One I borrow from Chris Klingenberg: you will always find a perfect association between two variables with just two individuals because you can always find a straight line connecting two points. From a different perspective : to *fairly* test for an association between variables, you need a sample size that allows you *not* to find an association. That means a sample size that could show equal variation in all the directions of the bidimensional space (i. e. draw a circumference).

Ok, maybe you’re not interested in testing the association among shape variables. But what about a PCA? Everybody has done a PCA on shape variables. Haven’t you realized that the number of PCs obtained are either 2k-4 for 2D datasets (k = number of landmarks, 3k-7 for 3D datasets) or N-1 (N number of individuals)? That depends on the number of individuals per variable. The PCA is an ordination method where orthogonal axes of variation are estimated: as in our toy example, the number of axes of variation will depend on the individuals per variable. In the case of two individuals and two variables, there is just one axis of variation, so one PC (N-1 PCs). If we add more individuals then a second axis of variation will show up and then we’ll get two PCs (2k-4 for 2D landmark data).
It makes sense, doesn’t it? With a PCA we remove all the directions of the phenotypic space in which there isn’t evidence of variation and we just keep the least possible variation per variable (i. e. only the variation differentiating our individuals), a line for two variables, a plane for three, etc. Actually, we sort of do that in our daily life: if I start to talk about my group of friends I will probably give you the least amount of information needed to differentiate each one of them, even though each one is different from the rest in millions of ways.
This has important consequences: first, that some of the variation we have theoretically considered with the addition of each variable is removed afterwards. If we run subsequent analyses on our PCs, we will not consider this theoretical variation. In addition, for certain statistical analyses (as covariation tests) we will always have an over-estimation of our estimates if our sample size is smaller or similar to our number of variables (remember? Always a perfect line between two points no matter the dimensionality).
Related to that, using more variables than individuals there will always be a combination of variables separating no matter which group of individuals we’re interested in (a problem leading to overfitting in regression and machine learning techniques): try to describe two people with two parameters (x and y), which can take values either 0 or 1. Only rule: both parameters can’t take the same values for both people (that wouldn’t count as 2 parameters). Spoiler: (at least) one of the parameters will be different for each person (so yes, for 2 individuals in 2D there’s just one PC with all the variance).
CVG
